conus-record-year-2026
Is 2026 on track to be the warmest year on record for the contiguous U.S.?
Short answer: probably. Using NOAA’s monthly data through August 2026, a set of simple statistical models gives roughly an 80% chance (range across models: about 65–87%) that 2026 finishes as the warmest year in the 132-year contiguous U.S. record, and about a 90% chance it finishes in the top two.
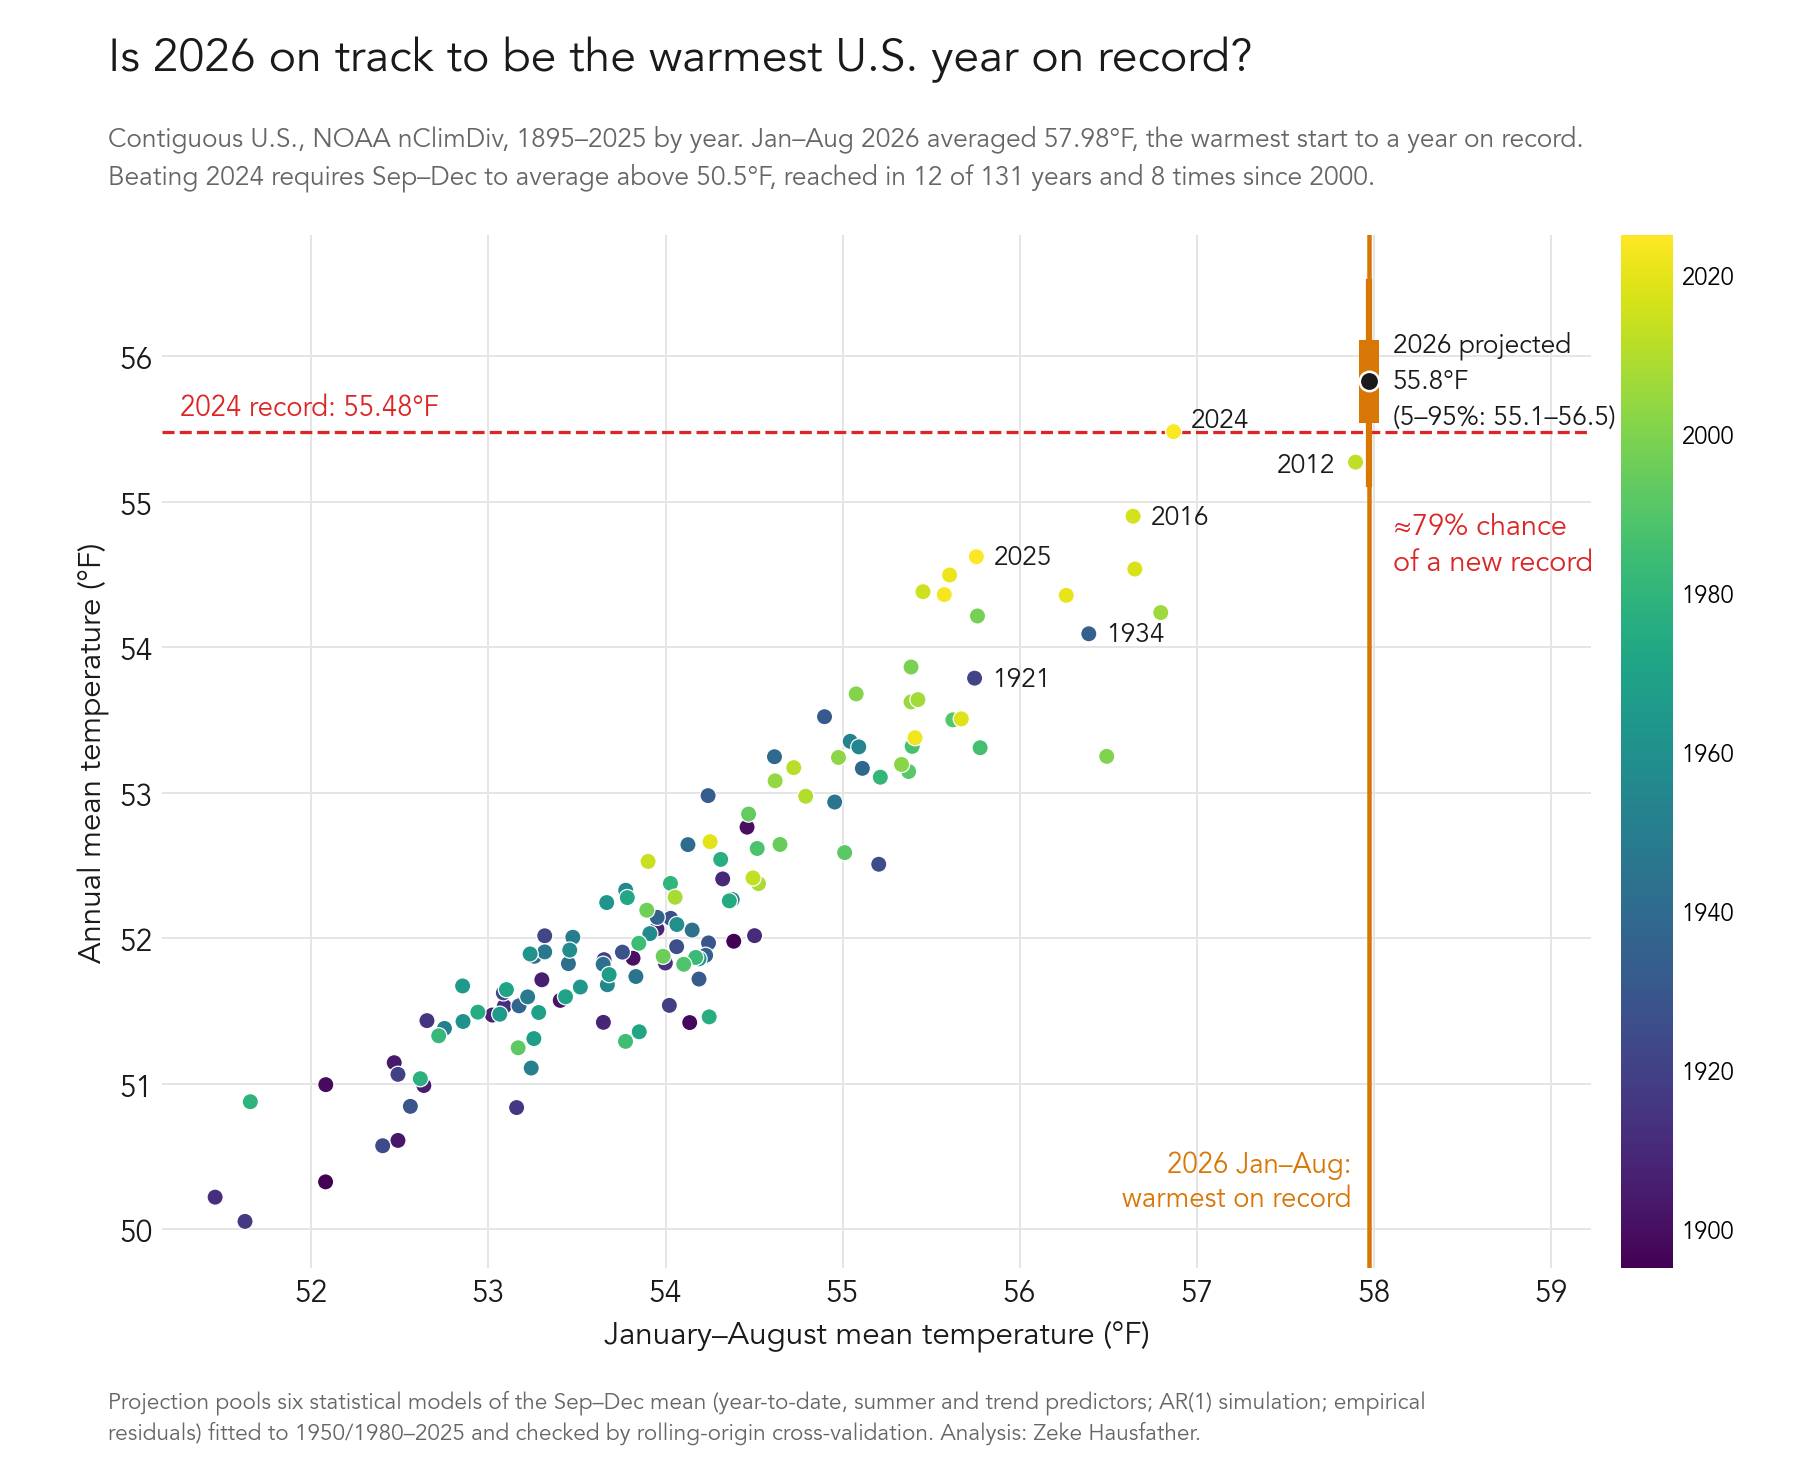
Analysis by Zeke Hausfather, 1 October 2026. Data through August 2026; the numbers will shift once NOAA publishes September. Full details, including cross-validation results and caveats, are in METHODS.md.
Key numbers
All values are contiguous U.S. (CONUS) average temperatures from NOAA’s Climate at a Glance (nClimDiv), in °F, with °C in brackets.
| Quantity | Value |
|---|---|
| January–August 2026 mean | 57.98 °F (14.43 °C), warmest January–August on record; 4.13 °F above the 20th-century average |
| Previous warmest January–August | 2012, 57.90 °F |
| Current annual record | 2024, 55.48 °F (13.04 °C) |
| Runner-up | 2012, 55.27 °F |
| September–December mean needed to beat 2024 | 50.50 °F (10.28 °C), about 2.2 °F above the 20th-century average for those months |
| September–December mean, 2016–2025 average | 50.96 °F, about 2.6 °F above the 20th-century average |
| Years when Sep–Dec exceeded 50.50 °F | 12 of 131, 8 of them since 2000 |
| Pooled projection for 2026 annual mean | 55.8 °F (13.2 °C), 5–95% range 55.1–56.5 °F |
| Probability 2026 beats 2024 | ~79% (model range 67–87%) |
| Probability 2026 finishes in the top two | ~90% |
NOAA’s annual value is the unweighted mean of the 12 monthly values (checked to within rounding), so the only unknown is the September–December mean. A 2012-style finish (Sep–Dec of 50.03 °F) would leave 2026 in second place at 55.33 °F.
How the odds were estimated
Six statistical models predict the September–December mean from what is already known, and the annual value follows arithmetically:
- Regression of Sep–Dec on the January–August mean plus a warming trend.
- The same with the June–August mean added as a predictor (recent months carry a little extra information).
- and 4. Versions of 1 and 2 with a trend that steepens after 1980.
- A simple month-to-month persistence (AR(1)) model simulated forward from the observed August anomaly.
- The trend value plus the last 30 years of observed Sep–Dec departures from trend.
Each model was tested by rolling-origin cross-validation (predicting each year 2000–2025 using only earlier years). Models fitted with a single linear trend from 1895 or 1950 under-predict recent autumns by 0.5–1 °F, because U.S. warming has accelerated, so the headline pools only the models that proved unbiased with properly sized uncertainty ranges. The spread of the pooled models is a fair representation of the structural uncertainty; see METHODS.md for the full tables.
What the estimate does not use: seasonal forecasts (such as NOAA CPC outlooks) or the current El Niño state. Historically El Niño has a mixed-sign and small effect on the CONUS annual mean.
Reproducing
pip install -r requirements.txt
./fetch_data.sh              # optional: refresh the NOAA series (data/ holds the 1 Oct 2026 snapshot)
python record_odds.py        # model fits, 2026 odds, cross-validation on 1980–2025
python cv2.py                # cross-validation on 2000–2025, hinge-trend models, hindcasts of 2012/2016/2024/2025
python make_figure.py        # pooled estimate, results/model_summary.csv, two-panel figure
python make_figure_simple.py # single-panel figure shown above
Files
data/cag_all_months.csv,data/cag_annual.csv: NOAA Climate at a Glance snapshots downloaded 1 October 2026.figures/: the single-panel figure above and a two-panel version that adds the full predictive distribution.results/model_summary.csv: per-model projections and probabilities.METHODS.md: data checks, model definitions, cross-validation and hindcast tables, caveats.
License and data
Code is released under the MIT License. NOAA nClimDiv / Climate at a Glance data are in the public domain as a U.S. Government work; please cite NOAA National Centers for Environmental Information, Climate at a Glance: National Time Series, retrieved 1 October 2026, from https://www.ncei.noaa.gov/access/monitoring/climate-at-a-glance/national/time-series.